Adding a Waveshare e-paper display to Home Assistant
(updated ) Eiko WagenknechtI wanted a way to display my home automation data without adding another glowing screen to my wall.
I also wanted an excuse to play around with e-paper displays.
So I decided to add a Waveshare e-paper display to my Home Assistant setup.
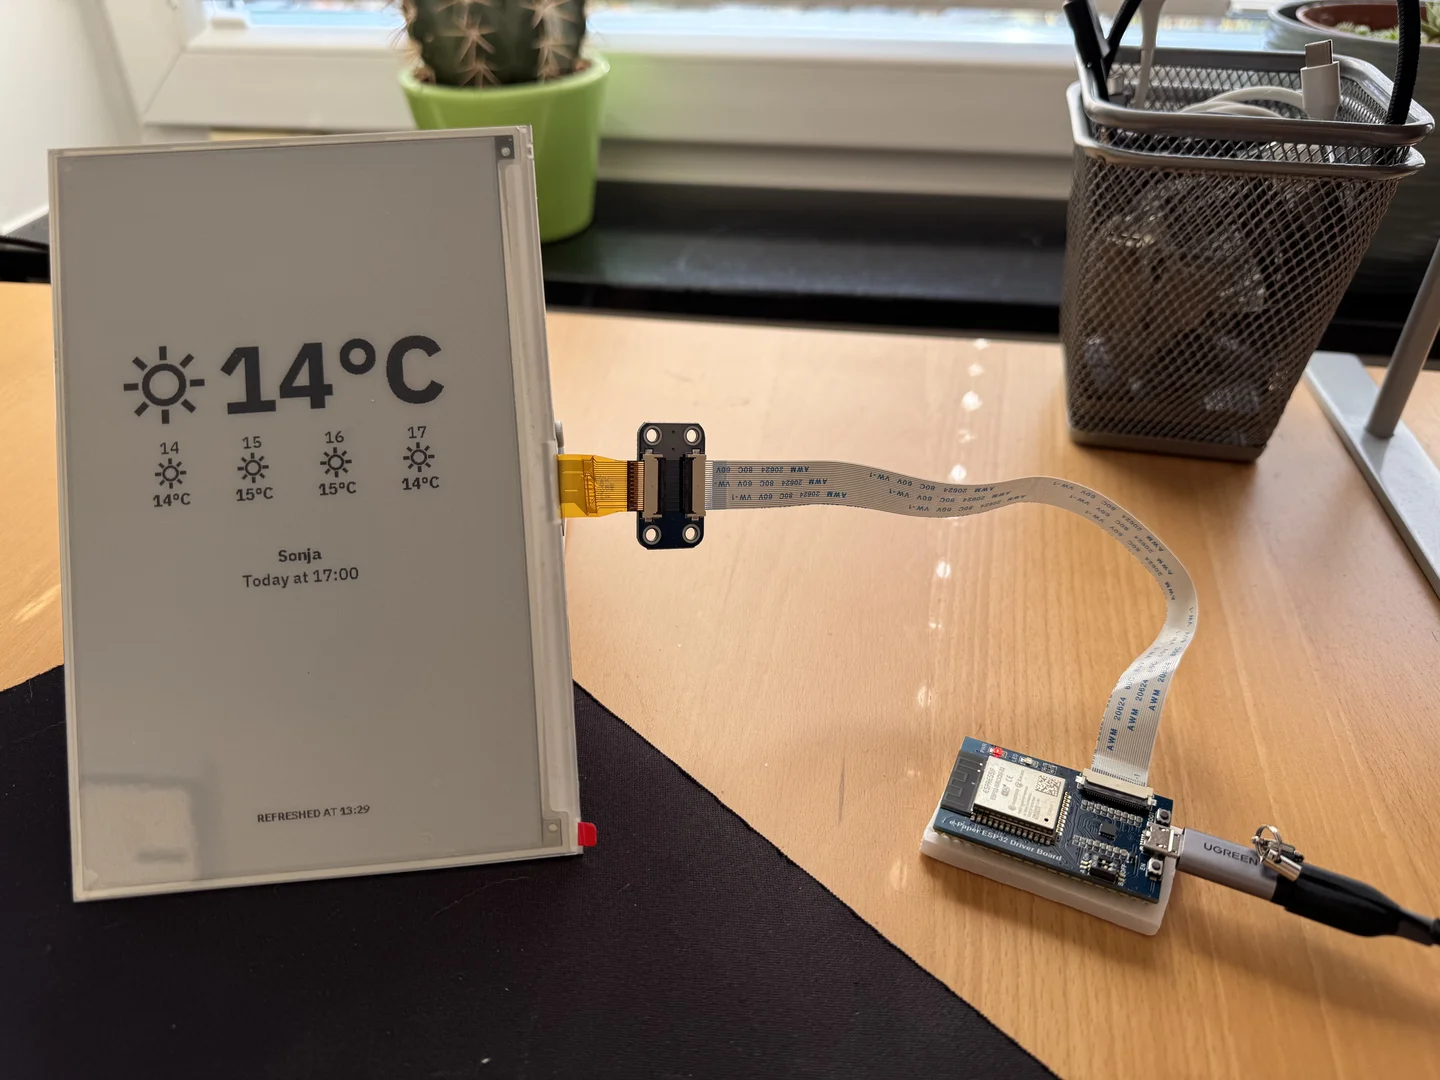
This is not completely finished yet. I will add a frame around the display and mount it on the wall.
Table of Contents
- The Hardware
- The Software
- Limitations
- Setting Up the Display
- Displaying text
- Setting up helpers for data display
- Displaying weather data
- Displaying calendar data
- Full configuration
- Credits
The Hardware
I opted for the Waveshare 7.5” e-paper display, which seems to be a popular choice among DIYers. It’s not too expensive, has a decent resolution and is (mostly) supported by the ESPHome firmware.
I bought the whole set here (affiliate link) for 71,50 EUR. It includes:
- The display: Waveshare 7.5”, 800x480 pixels, black and white (no grayscales), no backlight (manual, specs, schematic, official shop)
- The driver board: Waveshare ESP32 driver board (wiki, official shop) (includes the “e-Paper Adapter”, which is mostly a cable extension)
As of this post, there seem to be 3 versions of the display:
- V1 (600x384px)
- V2 “2019” (800x480px, June 2019 to August 2023)
- V2 “2023” (800x480px, from September 2023)
Mine has the following two labels identifying it as a “V2 2023” version:
- “075BN-T7” “2024031802” on the back
- “FPC-C001” “21.08.30” “HB” on the cable.
The Software
To control the display, I use ESPHome, which has support for Waveshare e-Paper displays built in. As ESPHome integrates very well with Home Assistant, this was an easy choice.
The driver board uses a CH343 serial port chip, for which you may need to install Windows or MacOS(https://files.waveshare.com/upload/5/50/CH34XSER_MAC_%285%29.7z) drivers. Previous versions before 2022-07-28 used a CP2102.
As of 2025-11-02, the ESPHome component finally supports partial refreshes (which I requested here). This means that there are only very few complete refreshes needed any more. The guide below has been updated with partial refreshes in mind. Please use a version of ESPHome that is newer than 2025-11-02, otherwise it won’t work.
Limitations
The display is black and white only. It does not support shades of gray. So there is no smooth font rendering or anti-aliasing. This can make text difficult to read, especially with smaller fonts.
Setting Up the Display
First you need to have ESPHome installed on your Home Assistant instance. If you don’t have it installed already, you can do so using this link. After installing the add-on (which took about 10 minutes on my Raspberry Pi 4), enable the “Show in sidebar” option in the add-on settings and start the add-on.
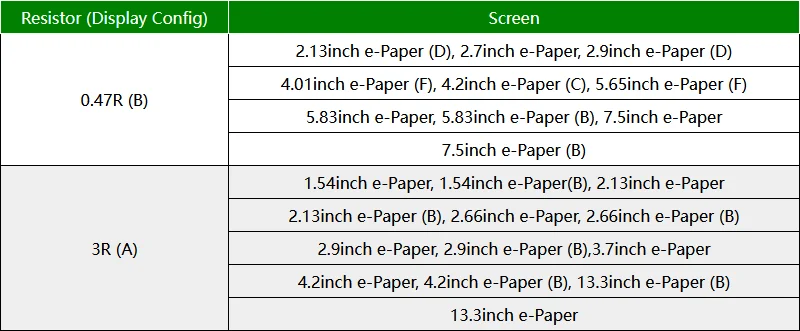
Meanwhile, you can set up the hardware. Connect the display to the driver board using the FPC cable. Make sure the switches on the driver board are set to “ON” and “B”. “ON” enables the serial port and “B” is a resistor setting that depends on the display.
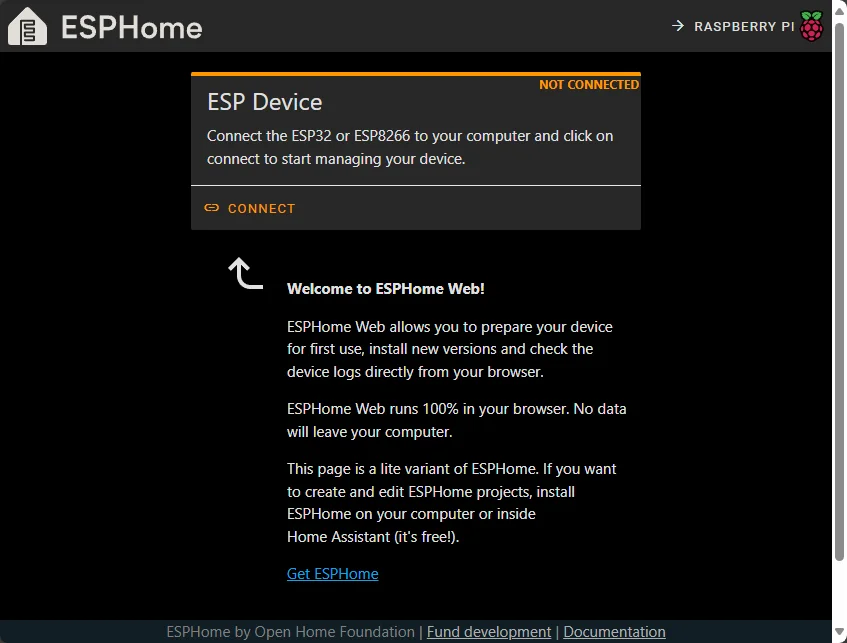
Connect the driver board to your computer using a USB cable. The driver board should now be detected as a serial port. To initialize the device, you can open the ESPHome Web Wizard with Chrome or Edge (Firefox will not work because it does not support the Web Serial API). This is a web-based tool that sets up your ESPHome device using the serial connection. Later on, you can use the ESPHome dashboard in Home Assistant to manage your devices and flash new firmware over the air.
Start by clicking the “Connect” button:
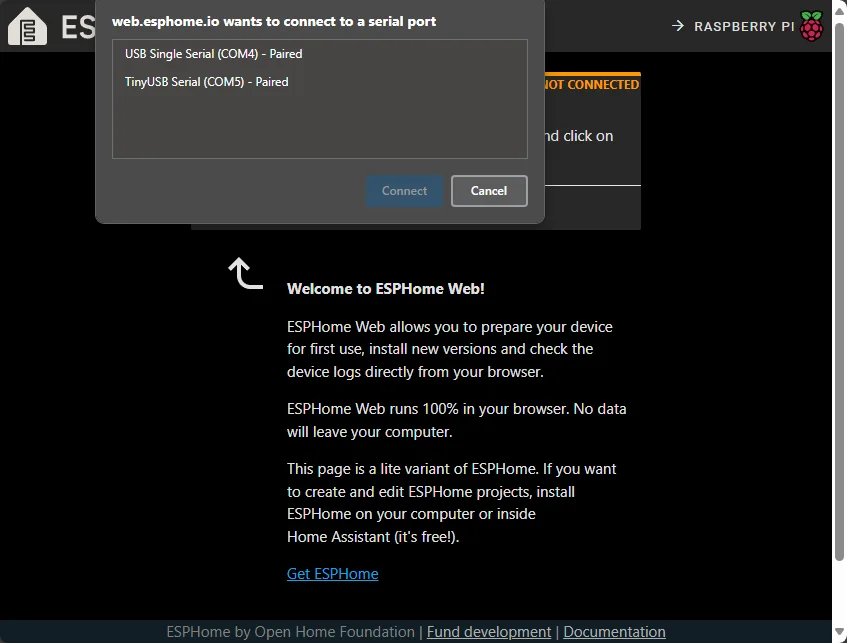
When asked, select “USB Single Serial (COMX)” as the port when asked. X is a number that depends on your system, in the screenshot above, it’s 4. If there are multiple ports, a pragmatic way to find the right one is to unplug the device, see which port disappears, and plug it back in to see which one reappears.
This will flash the ESPHome firmware to the device, which will take a few minutes.
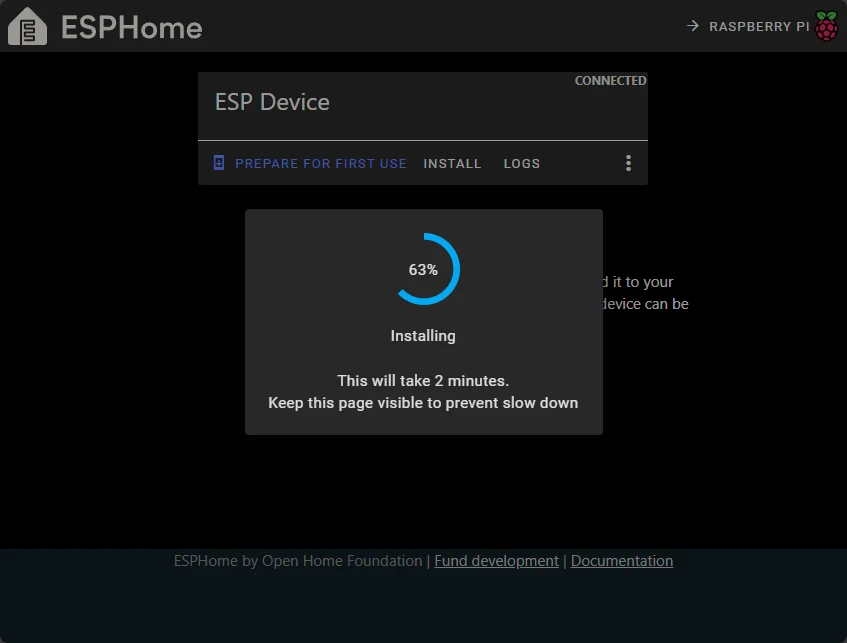
After selecting the port, click “Prepare for first use”.
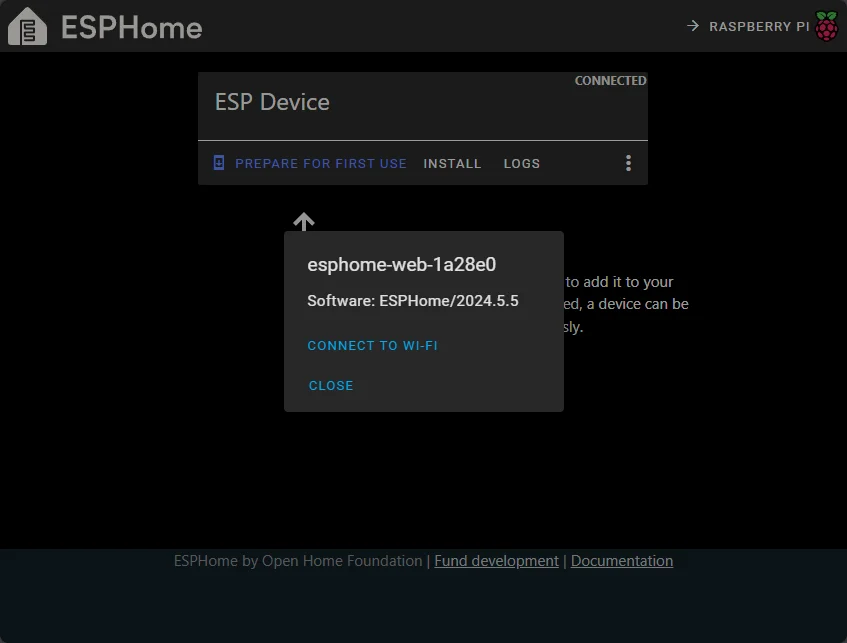
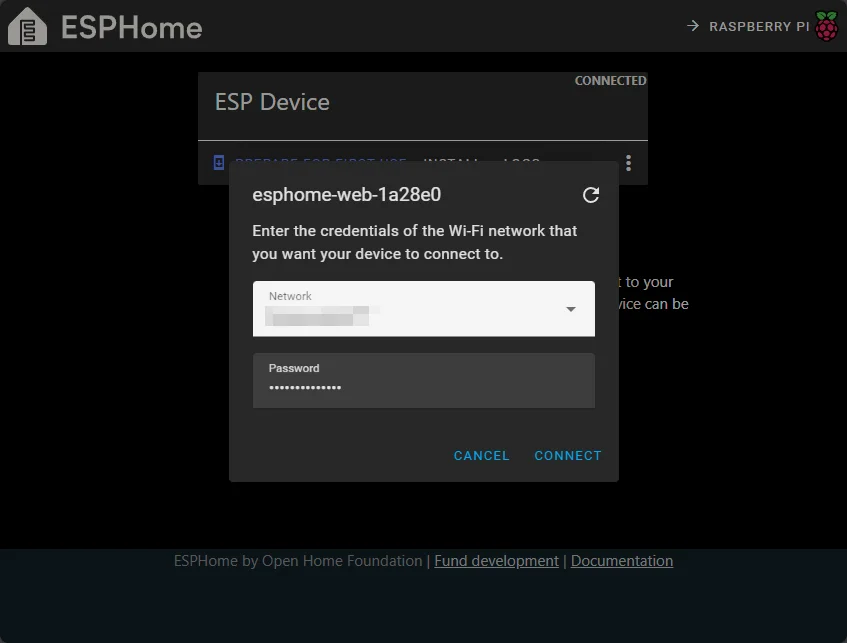
This will ask you to set up Wi-Fi, so enter your Wi-Fi credentials.
I highly recommend setting a static IP address for the device in your router settings before connecting it to Home Assistant. Now would be a good time to do this. Alternatively you can also use a static IP address in the ESPHome configuration.
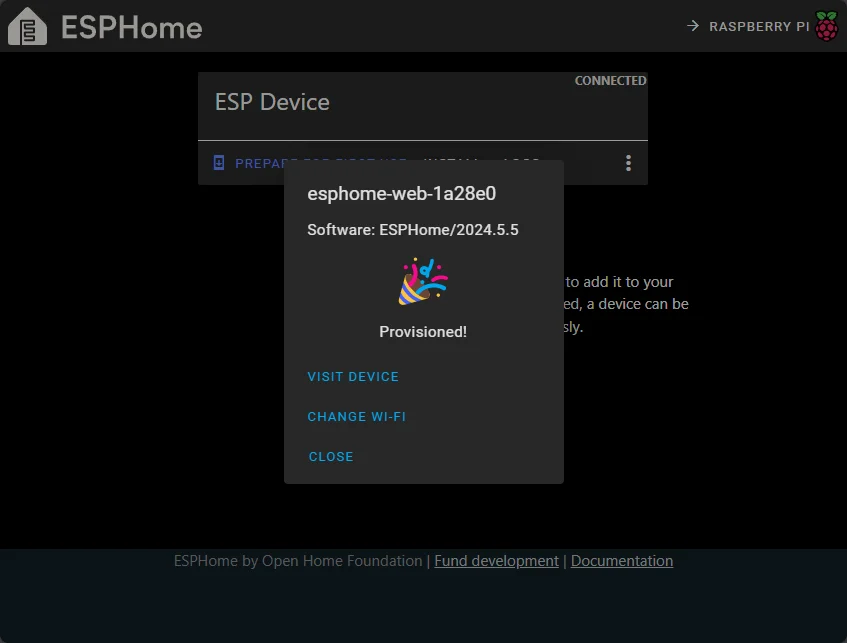
That’s it!
The device should now be automatically detected by the ESPHome web interface in Home Assistant:
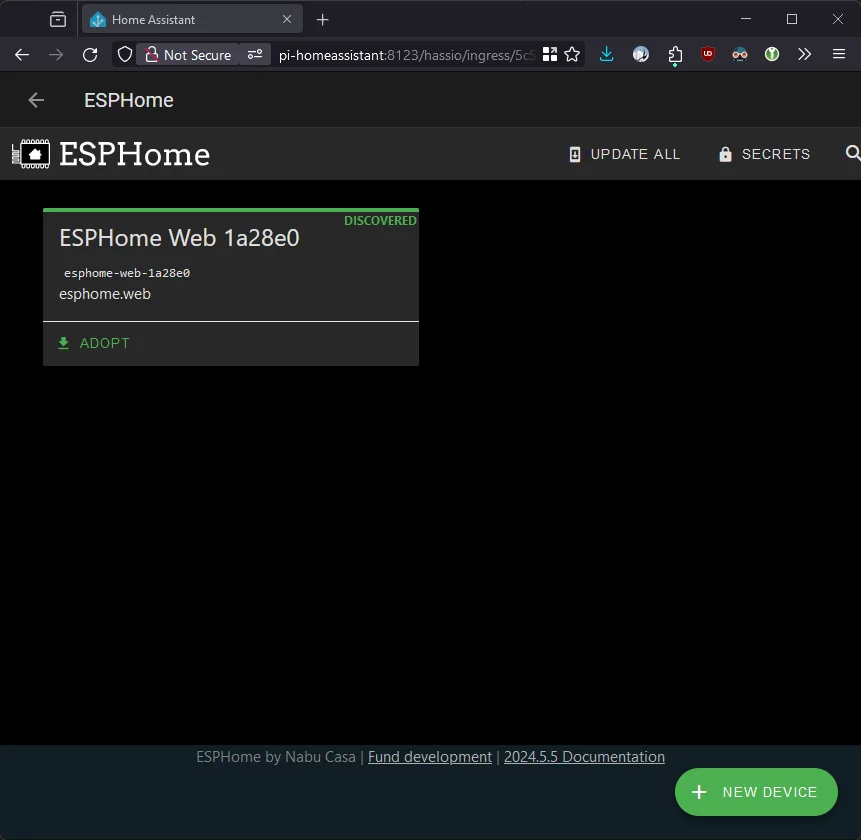
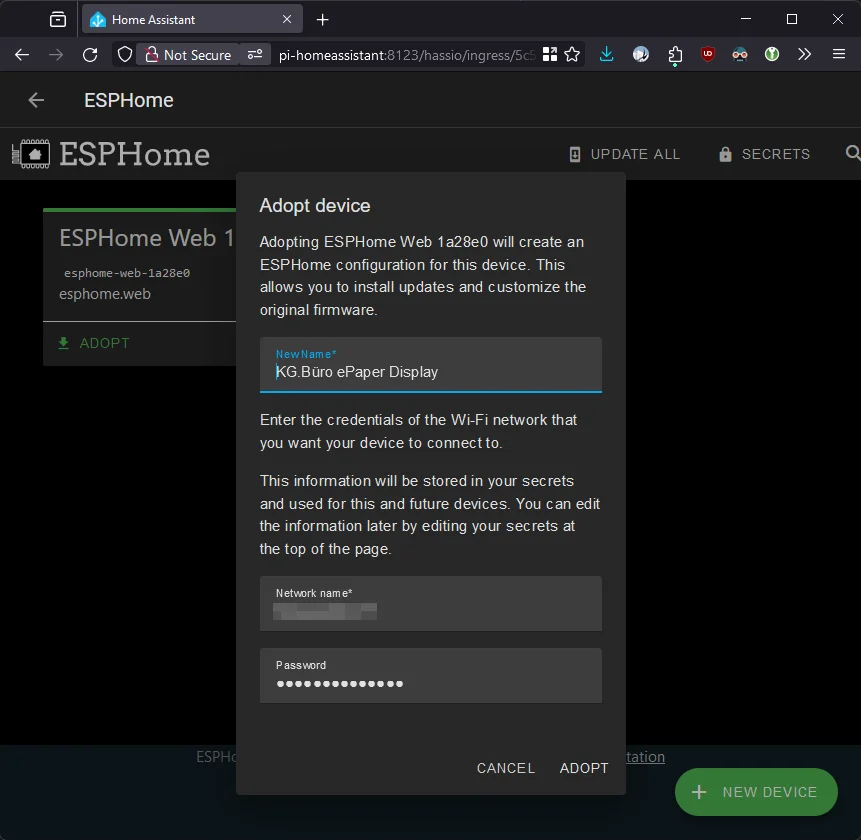
Adopt it by clicking on the “Adopt” button, giving it a name and providing the Wi-Fi credentials again.
Click “Install” to start flashing the firmware.
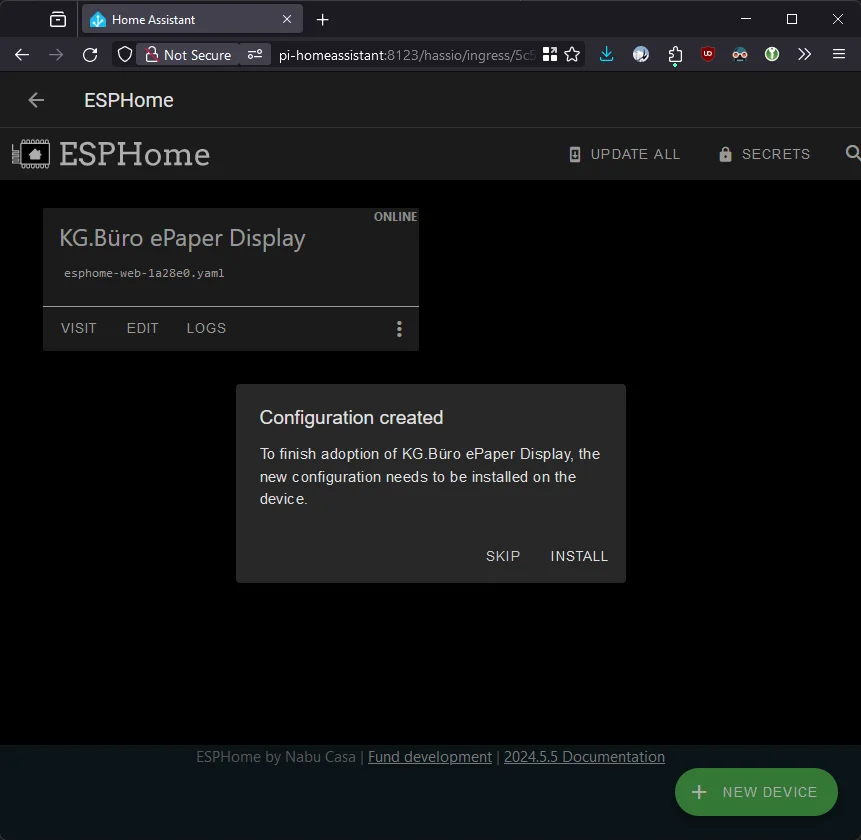
A new configuration is then generated and flashed to the device.
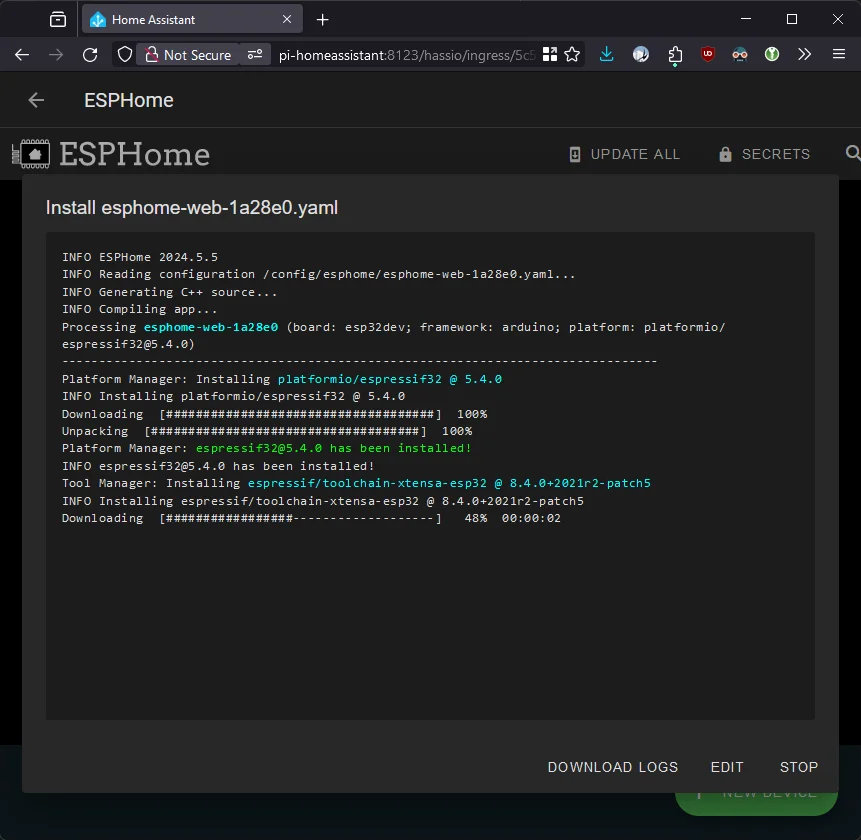
It will show the progress:
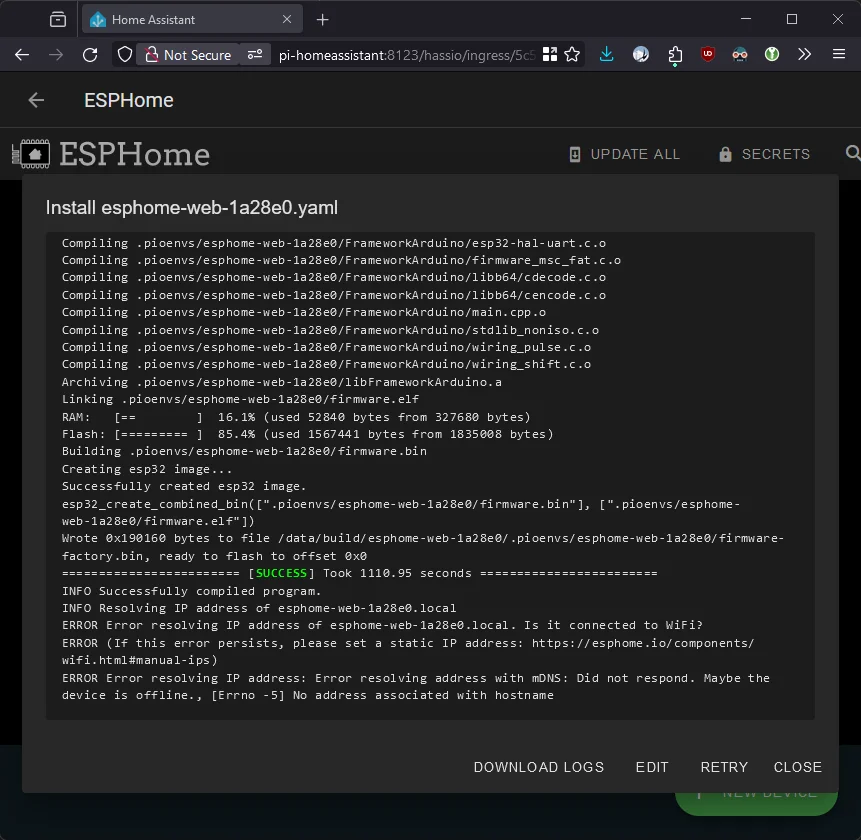
When it’s done, it should look like this:
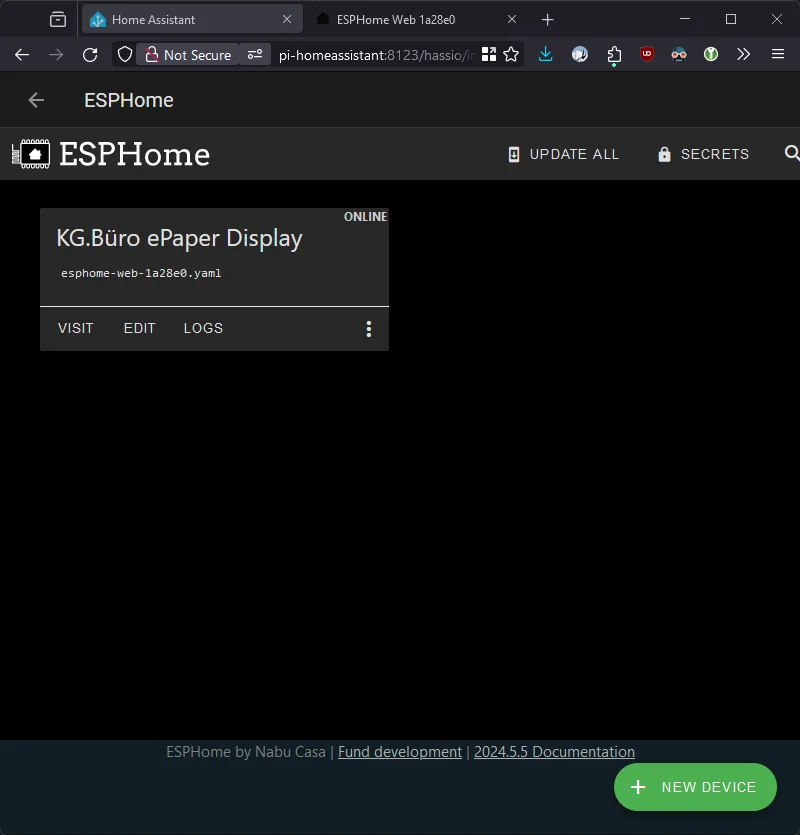
Now the device should show up as “Online” in the ESPHome dashboard. From now on, you can manage the device from the ESPHome dashboard in Home Assistant, edit the yaml configuration, and flash new firmware over the air.
Before we set up the display component, it’s important to reconfigure the automatically generated yaml file to avoid WiFi connection problems.
The full configuration file is at the end of this post. So feel free to skip this section if you just want to copy and paste the configuration.
Click “Edit” on the device in the ESPHome dashboard and change the wifi section to something like the following:
# WiFi configuration
wifi:
  # Get the WiFi credentials from the secrets.yaml file
  ssid: !secret wifi_ssid
  password: !secret wifi_password
  # Connect without scanning first. This is faster, but can lead to problems when there are multiple networks configured.
  fast_connect: True
  # Disable power saving to avoid disconnects from router. Ping for NONE: ~5ms, ping for LIGHT (default): ~50-300ms
  power_save_mode: NONE
  # Disable the domain (depends on your network setup)
  domain: ""

  # Enable a static IP address for faster connection
  manual_ip:
    static_ip: 192.168.1.123
    gateway: 192.168.1.1
    subnet: 255.255.255.0
    dns1: 192.168.1.1
Make sure to disable bluetooth in the esp32 section, as it will interfere with the WiFi connection:
# This needs to be disabled for reliable WiFi when used with the Waveshare display!
# esp32_improv:
#  authorizer: none
Displaying text
Since we will be displaying text on the screen, we need to set up a font. I wanted to use Inter for the text, but its baseline alignment is slightly different for uppercase and lowercase letters. Combined with the lack of anti-aliasing, this caused the lowercase letters to be displayed 1 pixel too high, making the text look wavy. I ended up using IBM Plex Sans, which has a more consistent baseline alignment.
font:
  - file: "gfonts://IBM+Plex+Sans@700"
    id: font_small_bold
    size: 18 # For this font, the actual height of a capital letter is 14 px
Once that is done, we can set up the actual display component and get it to display some text. For the PINs, you can find the config in the manual. This is the relevant section:

# Pins for Waveshare ePaper ESP Board
spi:
  # SPI Clock Pin
  clk_pin: GPIO13
  # SPI Master Out Slave In Pin
  mosi_pin: GPIO14

# Waveshare display configuration and actually displaying the data
display:
  - platform: waveshare_epaper
    id: screen
    # Chip Select Pin
    cs_pin: GPIO15
    # Data/Command Pin
    dc_pin: GPIO27
    # Busy Pin
    busy_pin:
      number: GPIO25
      inverted: true
    # Reset Pin
    reset_pin: GPIO26
    reset_duration: 2ms
    # New model with partial refresh support
    model: 7.50inv2p
    # Only do a full update every xth time to clear artifacts
    full_update_every: 30
    # Do not update automatically. We do this by a custom boot script + timer.
    update_interval: never
    # Show in portrait mode
    rotation: 90°
    # Resolution (portrait): x=480, y=800
    lambda: |-
      it.printf(240, 390, id(font_small_bold), color_text, TextAlign::BASELINE_CENTER, "HELLO WORLD");
Setting up helpers for data display
For convenience, we can add some global variables to keep track of when the display needs to be refreshed:
# Global variables for detecting if the display needs to be refreshed. (Thanks @paviro!)
globals:
  # Some data was updated (-> the screen needs to be refreshed)
  - id: data_updated
    type: bool
    restore_value: no
    initial_value: "false"
    # The connection with Home Assistant was established
  - id: initial_data_received
    type: bool
    restore_value: no
    initial_value: "false"
    # How often the screen was actually refreshed since boot
  - id: recorded_display_refresh
    type: int
    restore_value: yes
    initial_value: "0"
To enable / disable the display refresh, we can refer to a helper entity in Home Assistant:
# Enable updating of the screen (this can be set e.g. time based or when motion is in the room)
binary_sensor:
  - platform: homeassistant
    entity_id: input_boolean.kg_buero_display_refresh_enabled
    id: refresh_enabled
Then we can use these variables in a custom boot script to update the screen after the initial data was received:
esphome:
  name: ${name}
  friendly_name: ${friendly_name}
  name_add_mac_suffix: false
  project:
    name: esphome.web
    version: "1.0"
  # Boot script to update the screen on boot after the initial data was received
  on_boot:
    priority: 200.0
    then:
      - component.update: screen
      - wait_until:
          condition:
            lambda: "return id(data_updated) == true;"
        # Wait a bit longer so all the items are received at once
      - delay: 1s
      - logger.log: "Initial sensor data received: Refreshing display..."
      - lambda: "id(initial_data_received) = true;"
      - script.execute: update_screen
Whenever we want to update the screen, we can do so by calling a script:
# Script for updating screen and updating the variables
script:
  - id: update_screen
    then:
      # Reset the update tracker
      - lambda: "id(data_updated) = false;"
        # Refresh the screen
      - component.update: screen
        # Stats: Count the number of refreshes and when the last one was done
      - lambda: "id(recorded_display_refresh) += 1;"
      - lambda: "id(display_last_refresh).publish_state(id(homeassistant_time).now().timestamp);"
We can also add some buttons and sensors to the display to show up in Home Assistant:
button:
  - platform: shutdown
    name: "Shutdown"
  - platform: restart
    name: "Restart"
  - platform: template
    name: "Refresh Screen"
    entity_category: config
    on_press:
      - script.execute: update_screen

sensor:
  # Date of last refresh
  - platform: template
    name: "Last Refresh"
    device_class: timestamp
    entity_category: "diagnostic"
    id: display_last_refresh

    # Total number of refreshes
  - platform: template
    name: "Refreshes"
    accuracy_decimals: 0
    unit_of_measurement: "Refreshes"
    entity_category: "diagnostic"
    lambda: "return id(recorded_display_refresh);"

    # WiFi signal strength
  - platform: wifi_signal
    name: "WiFi Signal Strength"
    id: wifisignal
    unit_of_measurement: "dBm"
    entity_category: "diagnostic"
    update_interval: 60s
Displaying weather data
To display weather data, we can add template sensors in Home Assistant and then use these to display them on the screen.
Home Assistant configuration:
template:
  - trigger:
      - trigger: state
        entity_id:
          - weather.my_location
      - trigger: event
        event_type: event_template_reloaded
      - trigger: time_pattern
        minutes: "/5"
    action:
      - action: weather.get_forecasts
        data:
          type: hourly
        target:
          entity_id: weather.my_location
        response_variable: hourly
      - variables:
          hour0: "{{ hourly['weather.my_location'].forecast[0] }}"
          hour1: "{{ hourly['weather.my_location'].forecast[1] }}"
          hour2: "{{ hourly['weather.my_location'].forecast[2] }}"
          hour3: "{{ hourly['weather.my_location'].forecast[3] }}"
          hour4: "{{ hourly['weather.my_location'].forecast[4] }}"
    sensor:
      - unique_id: wetter_in_1h_temperatur
        name: Wetter in 1h Temperatur
        unit_of_measurement: "°C"
        state: "{{ hour1.temperature }}"
        device_class: temperature
      - unique_id: wetter_in_2h_temperatur
        name: Wetter in 2h Temperatur
        unit_of_measurement: "°C"
        state: "{{ hour2.temperature }}"
        device_class: temperature
      - unique_id: wetter_in_3h_temperatur
        name: Wetter in 3h Temperatur
        unit_of_measurement: "°C"
        state: "{{ hour3.temperature }}"
        device_class: temperature
      - unique_id: wetter_in_0h_temperatur
        name: Wetter in 0h Temperatur
        unit_of_measurement: "°C"
        state: "{{ hour0.temperature }}"
        device_class: temperature
      - unique_id: wetter_in_1h
        name: Wetter in 1h
        state: "{{ hour1.condition }}"
      - unique_id: wetter_in_2h
        name: Wetter in 2h
        state: "{{ hour2.condition }}"
      - unique_id: wetter_in_3h
        name: Wetter in 3h
        state: "{{ hour3.condition }}"
      - unique_id: wetter_in_0h
        name: Wetter in 0h
        state: "{{ hour0.condition }}"
      - unique_id: wetter_in_1h_zeit
        name: Wetter in 1h Zeit
        state: >
          {{ (as_datetime(hour1.datetime) | as_local).hour }}
      - unique_id: wetter_in_2h_zeit
        name: Wetter in 2h Zeit
        state: >
          {{ (as_datetime(hour2.datetime) | as_local).hour }}
      - unique_id: wetter_in_3h_zeit
        name: Wetter in 3h Zeit
        state: >
          {{ (as_datetime(hour3.datetime) | as_local).hour }}
      - unique_id: wetter_in_0h_zeit
        name: Wetter in 0h Zeit
        state: >
          {{ (as_datetime(hour0.datetime) | as_local).hour }}
Then we need to bridge these sensors to the display:
# Home Assistant sensors
sensor:
  # Weather - Temperature
  - platform: homeassistant
    entity_id: weather.my_location
    attribute: temperature
    id: weather_temperature
    on_value:
      then:
        - lambda: "id(data_updated) = true;"

    # Weather - Temperature in 0h
  - platform: homeassistant
    entity_id: sensor.wetter_in_0h_temperatur
    id: weather_temperature_0h
    on_value:
      then:
        - lambda: "id(data_updated) = true;"

    # Weather - Temperature in 1h
  - platform: homeassistant
    entity_id: sensor.wetter_in_1h_temperatur
    id: weather_temperature_1h
    on_value:
      then:
        - lambda: "id(data_updated) = true;"

    # Weather - Temperature in 2h
  - platform: homeassistant
    entity_id: sensor.wetter_in_2h_temperatur
    id: weather_temperature_2h
    on_value:
      then:
        - lambda: "id(data_updated) = true;"

    # Weather - Temperature in 3h
  - platform: homeassistant
    entity_id: sensor.wetter_in_3h_temperatur
    id: weather_temperature_3h
    on_value:
      then:
        - lambda: "id(data_updated) = true;"

text_sensor:
  # Weather - Condition
  - platform: homeassistant
    entity_id: weather.my_location
    id: weather_condition
    on_value:
      then:
        - lambda: "id(data_updated) = true;"
    # Weather - Condition in 0h
  - platform: homeassistant
    entity_id: sensor.wetter_in_0h
    id: weather_condition_0h
    on_value:
      then:
        - lambda: "id(data_updated) = true;"
    # Weather - Condition in 1h
  - platform: homeassistant
    entity_id: sensor.wetter_in_1h
    id: weather_condition_1h
    on_value:
      then:
        - lambda: "id(data_updated) = true;"
    # Weather - Condition in 2h
  - platform: homeassistant
    entity_id: sensor.wetter_in_2h
    id: weather_condition_2h
    on_value:
      then:
        - lambda: "id(data_updated) = true;"
    # Weather - Condition in 3h
  - platform: homeassistant
    entity_id: sensor.wetter_in_3h
    id: weather_condition_3h
    on_value:
      then:
        - lambda: "id(data_updated) = true;"
    # Weather - Time in 0h
  - platform: homeassistant
    entity_id: sensor.wetter_in_0h_zeit
    id: weather_time_0h
    on_value:
      then:
        - lambda: "id(data_updated) = true;"
    # Weather - Time in 1h
  - platform: homeassistant
    entity_id: sensor.wetter_in_1h_zeit
    id: weather_time_1h
    on_value:
      then:
        - lambda: "id(data_updated) = true;"
    # Weather - Time in 2h
  - platform: homeassistant
    entity_id: sensor.wetter_in_2h_zeit
    id: weather_time_2h
    on_value:
      then:
        - lambda: "id(data_updated) = true;"
    # Weather - Time in 3h
  - platform: homeassistant
    entity_id: sensor.wetter_in_3h_zeit
    id: weather_time_3h
    on_value:
      then:
        - lambda: "id(data_updated) = true;"
We need some more fonts and also icons:
# Google Fonts
font:
  # Icons
  - file: "gfonts://Material+Symbols+Outlined"
    id: icons_large
    size: 96 # Optical size (square): 72 px. Put 10px below font_large_bold text to visually align.
    # For the code points (see https://fonts.google.com/icons)
    # HA states from core/homeassistant/components/weather//__init__.py
    glyphs: &weather_icons
      - "\U0000ef44" # clear-night // mdi-bedtime
      - "\U0000e2bd" # cloudy // mdi-cloud
      - "\U0000f3cc" # exceptional // mdi-cloud-alert
      - "\U0000e818" # fog // mdi-foggy
      - "\U0000f67f" # hail // mdi-hail
      - "\U0000ebdb" # lightning and lightning-rainy // mdi-thunderstorm
      - "\U0000f172" # partlycloudy // mdi-partly-cloudy-day
      - "\U0000f176" # pouring and rainy // mdi-rainy
      - "\U0000e2cd" # snowy and snowy-rainy // mdi-weather-snowy
      - "\U0000e81a" # sunny // mdi-sunny
      - "\U0000f070" # windy and windy-variant // mdi-storm
      - "\U0000eb36" # test only square
  - file: "gfonts://Material+Symbols+Outlined"
    id: icons_medium
    size: 36 # Optical size (square): 28 px, push down 4px to align bottom with baseline (square)
    glyphs: *weather_icons
  # Fonts
  - file: "gfonts://IBM+Plex+Sans@700"
    id: font_large_bold
    size: 108 # For this font, the actual height of a capital letter is 78 px
  - file: "gfonts://IBM+Plex+Sans@700"
    id: font_small_bold
    size: 18 # For this font, the actual height of a capital letter is 14 px
  - file: "gfonts://IBM+Plex+Sans@500"
    id: font_small_medium
    size: 18 # For this font, the actual height of a capital letter is 14 px
  - file: "gfonts://IBM+Plex+Sans@700"
    id: font_tiny_bold
    size: 12 # For this font, the actual height of a capital letter is 9 px
This can be used in the lambda function to display the data:
// Helper: Map weather states to icons
std::map<std::string, std::string> weather_icon_map = {
{"clear-night", "\U0000ef44"}, // test square: "\U0000eb36"
{"cloudy", "\U0000e2bd"},
{"exceptional", "\U0000f3cc"},
{"fog", "\U0000e818"},
{"hail", "\U0000f67f"},
{"lightning", "\U0000ebdb"},
{"lightning-rainy", "\U0000ebdb"},
{"partlycloudy", "\U0000f172"},
{"pouring", "\U0000f176"},
{"rainy", "\U0000f176"},
{"snowy", "\U0000e2cd"},
{"snowy-rainy", "\U0000e2cd"},
{"sunny", "\U0000e81a"},
{"windy", "\U0000f070"},
{"windy-variant", "\U0000f070"}
};
// Helper: Parse Unix Timestamp
auto parse_unix_timestamp = [](const char* timestamp) -> time_t {
struct tm tm = {};
// Parse ISO 8601 timestamp
strptime(timestamp, "%Y-%m-%dT%H:%M:%S%z", &tm);
return mktime(&tm);
};
// Helper: Current Time
time_t currentTime = id(homeassistant_time).now().timestamp;
if (id(initial_data_received) == false) {
// Booting up screen
it.printf(240, 390, id(font_small_bold), color_text, TextAlign::BASELINE_CENTER, "BOOTED, WAITING FOR DATA...");
} else {
// Weather: Temperature
it.printf(160, 300, id(font_large_bold), color_text, TextAlign::BASELINE_LEFT, "%.0f°C", id(weather_temperature).state);
// Weather: Condition icon
// 10 pixel below text to center align with it visually
it.printf(150, 300 + 10, id(icons_large), color_text, TextAlign::BASELINE_RIGHT, "%s", weather_icon_map[id(weather_condition).state.c_str()].c_str());
// Layout helpers
//it.line(20, 300, 240, 300, color_text); // Baseline
//it.line(20, 300 - 78, 240, 300 - 78, color_text); // Top
// Hour: Baseline = 0px
// Icon: Baseline = 8px (margin) + 28px (icon size) + 4px (icon offset) = 40px
// Temp: Baseline = 8px (margin) + 28px (icon size) + 14px (text size) + 8px (margin) = 58px
// Weather: In 0h
it.printf(105, 340, id(font_small_medium), color_text, TextAlign::BASELINE_CENTER, "%s", id(weather_time_0h).state.c_str());
it.printf(105, 340 + 40, id(icons_medium), color_text, TextAlign::BASELINE_CENTER, "%s", weather_icon_map[id(weather_condition_0h).state.c_str()].c_str());
it.printf(105, 340 + 58, id(font_small_bold), color_text, TextAlign::BASELINE_CENTER, "%2.0f°C", id(weather_temperature_0h).state);
// Weather: In 1h
it.printf(195, 340, id(font_small_medium), color_text, TextAlign::BASELINE_CENTER, "%s", id(weather_time_1h).state.c_str());
it.printf(195, 340 + 40, id(icons_medium), color_text, TextAlign::BASELINE_CENTER, "%s", weather_icon_map[id(weather_condition_1h).state.c_str()].c_str());
it.printf(195, 340 + 58, id(font_small_bold), color_text, TextAlign::BASELINE_CENTER, "%2.0f°C", id(weather_temperature_1h).state);
// Weather: In 2h
it.printf(285, 340, id(font_small_medium), color_text, TextAlign::BASELINE_CENTER, "%s", id(weather_time_2h).state.c_str());
it.printf(285, 340 + 40, id(icons_medium), color_text, TextAlign::BASELINE_CENTER, "%s", weather_icon_map[id(weather_condition_2h).state.c_str()].c_str());
it.printf(285, 340 + 58, id(font_small_bold), color_text, TextAlign::BASELINE_CENTER, "%2.0f°C", id(weather_temperature_2h).state);
// Weather: In 3h
it.printf(375, 340, id(font_small_medium), color_text, TextAlign::BASELINE_CENTER, "%s", id(weather_time_3h).state.c_str());
it.printf(375, 340 + 40, id(icons_medium), color_text, TextAlign::BASELINE_CENTER, "%s", weather_icon_map[id(weather_condition_3h).state.c_str()].c_str());
it.printf(375, 340 + 58, id(font_small_bold), color_text, TextAlign::BASELINE_CENTER, "%2.0f°C", id(weather_temperature_3h).state);
// Footer: Refresh Timestamp (see https://community.home-assistant.io/t/esphome-show-time/348903)
char timeString[17];
strftime(timeString, sizeof(timeString), "%H:%M", localtime(¤tTime));
it.printf(240, 750, id(font_tiny_bold), color_text, TextAlign::BASELINE_CENTER, "REFRESHED AT %s", timeString);
}Displaying calendar data
I have multiple Google calendars and wanted to display the next event (no matter in which calender) on the screen.
For the setup, I used the Google Calendar integration in Home Assistant. See the documentation for more information how to get the calendars into Home Assistant.
Then I set up the sensors in ESPHome:
text_sensor:
  # Calendar - Title
  - platform: homeassistant
    entity_id: calendar.eiko_wagenknecht
    attribute: message
    id: next_event_title_1
    on_value:
      then:
        - lambda: "id(data_updated) = true;"
  # Calendar - Start Time
  - platform: homeassistant
    entity_id: calendar.eiko_wagenknecht
    attribute: start_time
    id: next_event_start_1
    on_value:
      then:
        - lambda: "id(data_updated) = true;"
  # Calendar 2 - Title
  - platform: homeassistant
    entity_id: calendar.gemeinsame_termine
    attribute: message
    id: next_event_title_2
    on_value:
      then:
        - lambda: "id(data_updated) = true;"
  # Calendar 2- Start Time
  - platform: homeassistant
    entity_id: calendar.gemeinsame_termine
    attribute: start_time
    id: next_event_start_2
    on_value:
      then:
        - lambda: "id(data_updated) = true;"
And then display the data. Put this between the weather and the footer:
// Calendar
auto parse_event_time = [](const std::string& time_str) -> time_t {
  struct tm event_tm = {};
  strptime(time_str.c_str(), "%Y-%m-%d %H:%M:%S", &event_tm);
  event_tm.tm_isdst = -1;
  return mktime(&event_tm);
};

// Array of text_sensor IDs for calendars - add more as needed
std::vector<std::pair<text_sensor::TextSensor*, text_sensor::TextSensor*>> calendars = {
  {id(next_event_title_1), id(next_event_start_1)},
  {id(next_event_title_2), id(next_event_start_2)},
  // Add more pairs here as needed
};

// Initialize variables for the earliest event
time_t earliest_time = LONG_MAX;
std::string event_title;
struct tm event_tm = {};

// Check all calendars
for (const auto& calendar : calendars) {
  if (!calendar.second->state.empty()) {
    time_t event_time = parse_event_time(calendar.second->state);
    if (event_time < earliest_time) {
      earliest_time = event_time;
      event_title = calendar.first->state;
      strptime(calendar.second->state.c_str(), "%Y-%m-%d %H:%M:%S", &event_tm);
      event_tm.tm_isdst = -1;
    }
  }
}

// Display the earliest event if we found one
if (earliest_time != LONG_MAX) {
  // Get dates without time
  time_t currentDate = currentTime - (currentTime % 86400);
  time_t eventDate = earliest_time - (earliest_time % 86400);

  // Calculate day difference
  int daysDiff = (eventDate - currentDate) / 86400;

  char timeStr[32];
  if (daysDiff == 0) {
    strftime(timeStr, sizeof(timeStr), "Today at %H:%M", &event_tm);
  } else if (daysDiff == 1) {
    strftime(timeStr, sizeof(timeStr), "Tomorrow at %H:%M", &event_tm);
  } else {
    strftime(timeStr, sizeof(timeStr), "%Y-%m-%d at %H:%M", &event_tm);
  }

  // Draw the event title and time
  it.printf(240, 450, id(font_small_bold), color_text, TextAlign::TOP_CENTER, "%s", event_title.c_str());
  it.printf(240, 475, id(font_small_medium), color_text, TextAlign::TOP_CENTER, "%s", timeStr);
}
Full configuration
You can find the full configuration file for the display, as I use it, on my GitHub resources repository: Home Assistant / Waveshare 7.5” ePaper Configuration
It shows the current weather, a forecast for the next 4 hours and the next calendar event from any of the configured calendars.
The result looks like the image at the top of this post.
Credits
This was very much inspired by the awesome esphome-weatherman-dashboard project. It’s also been discussed in the Home Assistant Community and has inspired many people (including me) to build their own displays.
No Comments? No Problem.
This blog doesn't support comments, but your thoughts and questions are always welcome. Reach out through the contact details at the bottom of the page.
Support Me
If you found this page helpful and want to say thanks, you can support me here.
